The new version of Cognos, Cognos Analytics (aka Cognos 11), is here – but what is actually new?
IBM say that with Cognos Analytics they are bridging the ‘analytic chasm’. This means they are combining ‘traditional BI’ – production-driven, enterprise-grade, fully defined solutions, with ‘exploratory analytics’ – user-driven, silo-based, data discovery, because both are fundamental to a successful analytics platform.
How? They have given the whole system a major facelift and integrated functions from other products such as Watson Analytics and Hadoop, to offer a BI platform on par with competitors such as Qlik and Tableau for interactivity and visual appeal. They have achieved this whilst removing very little from the robust, tried and tested enterprise solution that Cognos has always been.
This article will look at what is different (and what’s not), by user type…
Consumer
For a light touch user, someone who is not creating ad hoc analysis, the main difference is the UI. Cognos Connection has been replaced with something known as the ‘portal’. The portal is clean and modern and features a sliding panel ‘content explorer’. Public Folders and My Folders have been replaced with My Content and Team Content. The search function is hugely improved, it searches as you type and is much faster. Icons for properties and studios are gone, replaced with a simple ellipses icon. Subscribe is a new function which allows a consumer to subscribe to a report on a regular schedule. This creates a report view in their My Content folder according to the schedule they choose.
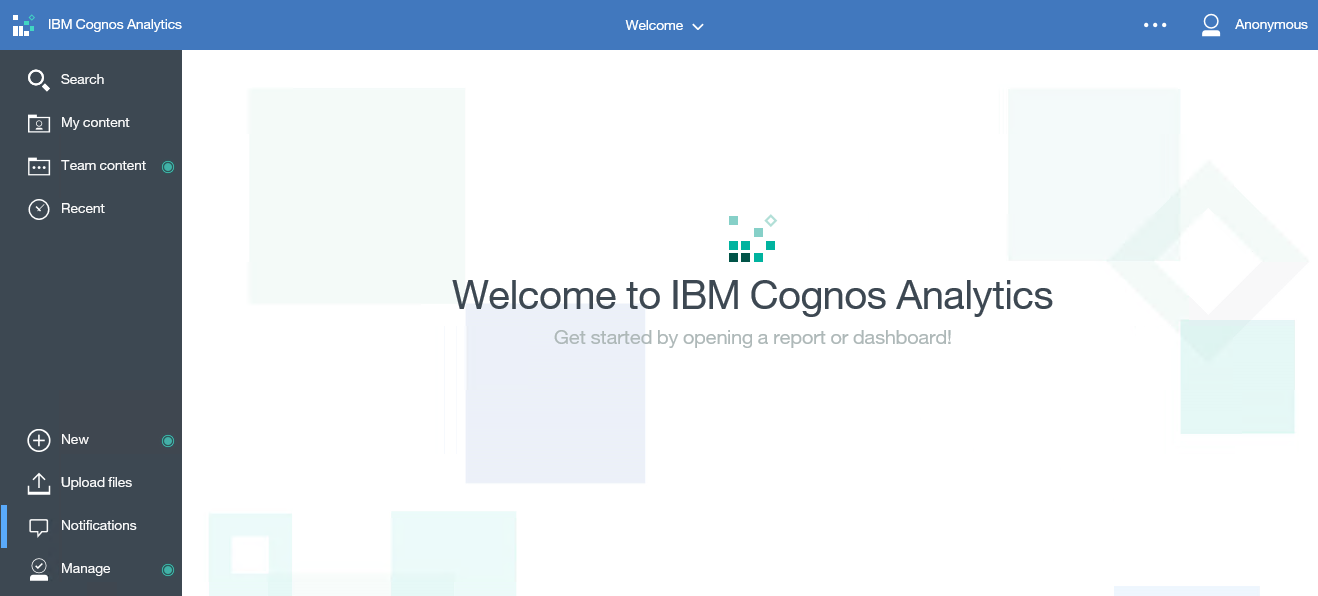
Normal background schedules have not changed and nor has My Inbox (other than a facelift).
Creator (IBM term for ad hoc user)
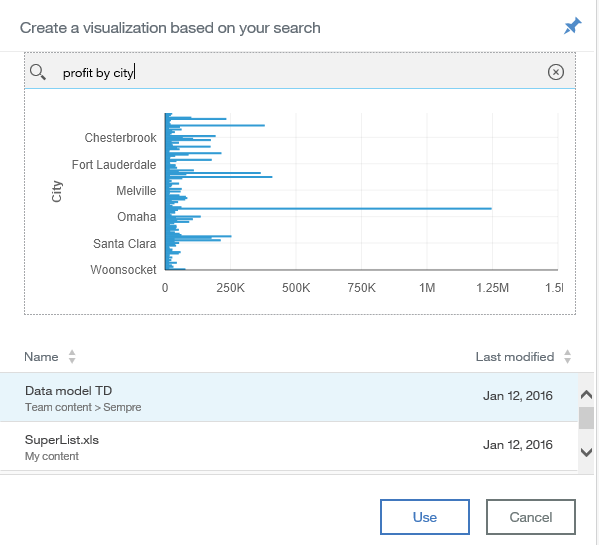
There’s a lot of new content for the self-service user. A new tool called ‘Data Module’, allows users to connect to tables or flat files and perform basic data modelling. The system uses Watson Analytics technology to allow ‘intent-based modelling’, meaning a user can type their interest (e.g ‘Revenue’) and the tool will search for that text within the data source columns and return relevant information. Calculations can be created and shared filters can be defined. The data is stored in Apache Parquet file format, which Apache define as ‘a columnar storage format available to any project in the Hadoop ecosystem’. What it means for Cognos users is very quick storage and retrieval of data. These models can then be shared, according to the underpinning agenda of re-using content. There is also a Snapshot function available which allows users to create slices of historical data on the local disk.
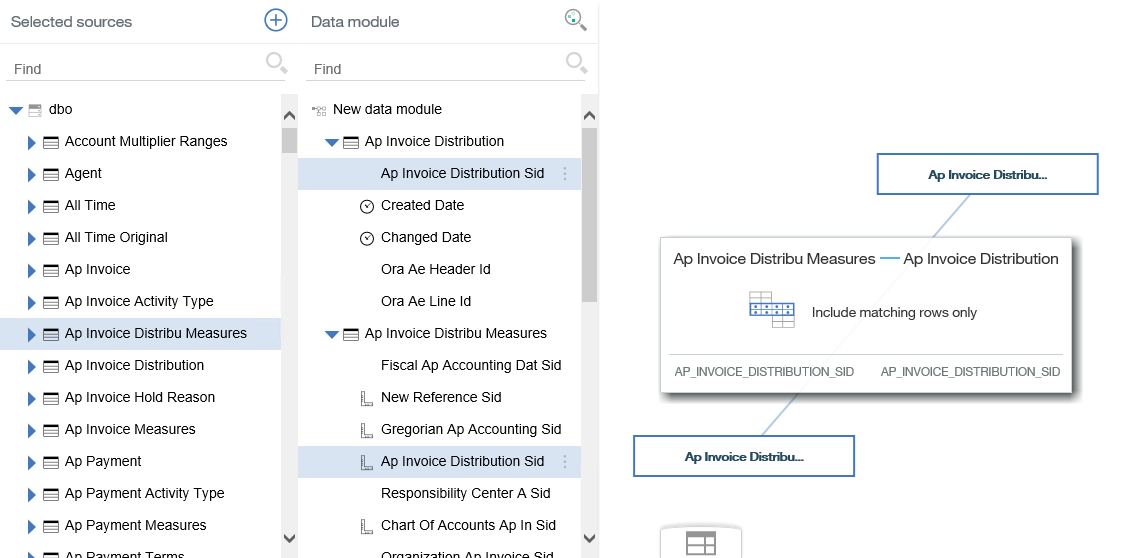
It is important to mention that dimensional data sources, such as Cognos Power cubes or TM1, cannot be used in Data Module and we have seen no literature suggesting it will be any time soon. This makes sense when you realise the tool is creating joins between flat table structures, so it will be interesting to see how this develops.
The new ‘Dashboard’ tool, which will be familiar to those who have seen Watson Analytics, allows analysis on the Data Module models. The tool features prebuilt layouts and will make suggestions as to how the user would want to view the data. It’s very intuitive and visually appealing.
Query Studio, Analysis Studio and a simplified Workspace all still exist and remain largely unchanged, despite earlier announcements saying they were becoming obsolete.
FYI
- There is no drill through available in Data Modules
- Data Modules do not work as folders like FM packages did
- Dashboards can reference more than 1 Data Module
- The setting to expose a JDBC data source to Data Module is in the properties of the data source connection
- There is currently no schedule facility for the Snapshot function but maybe in the future
- You cannot union 2 uploaded files in this release
Developer
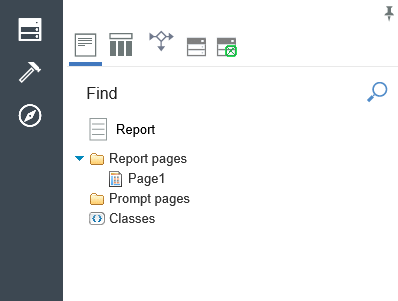
The biggest difference that users of Report Studio will see is the new tool, ‘Report’. This replaces both Workspace Advanced and Report Studio and has had the big make-over. All the functionality of both pervious tools has been retained but the layout and menus have been re-organised. The ability to see live data on the canvas, as you could in Workspace Advanced, can be switched on or off in the tool.
There is a new option called ‘Run with full interactivity’, which is not currently working as it will. In future, if set to ‘yes’, it will allow new functions such as interactive toolbars to show, but at the moment it causes a limitation of functions such as removing drill through and prompt pages. This means for now it needs to be set to ‘no’. By default new reports will be set to ‘yes’.
Cognos Administration has not changed and all the other old studios and functions are still available, including Framework Manager, Transformer, Event Studio, DQM and Dynamic Cubes.
However:
- Conditional Styles are not yet working on Data Modules
- Reports based on multiple packages are not available yet but you can join packages in Data Module
- The separate profiles for ‘Report Studio’ access and ‘Ad Hoc’ access are not yet implemented so anyone with Authoring capabilities can use the whole tool
- Cognos 10 used quirks HTML, now standard HTML is being used
- ISAPI and CGI are needed for Active Directory and SSO
- IIS needs a ReverseProxy rule adding
There are a number of documents from IBM detailing what is currently not working fully in this release and what they are intending to improve/add in following releases, but it doesn’t appear that anything vital has been removed from Cognos Analytics. The self-service aspect is hugely improved and should only continue to get better (usable even), with each release and there’s no question that the software is better looking than it has been.
The migration of content and upgrading from Cognos v10.x seems to be very simple using a typical deployment or content store upgrade, but given the number of improvements that will come in future releases we recommend waiting for the extra functionality before upgrading. Waiting for a fix pack should also reduce the number of patches, reduce the number of changes to end users and limit confusion regarding functions that exist in the UI but are not fully implemented. Hopefully this will happen soon as we’re excited to start using it.
Kym Wilson, BI Consultant and blog contributor at Sempre Analytics, recently published the following article on LinkedIn.

Listed in:
- Cognos Analytics