


9 Reasons Why Upgrading to Cognos Analytics 11.2.4 LTSR is a Smart Move
IBM has been continuously updating and releasing new versions of their software to keep up with the latest advancements. With the release of version 12, it’s even more important for organisations to ensure they’re on a supported long-term release version of the product.
Being on the cutting edge of technology is always exciting for many technology enthusiasts. However, while this may excite those who have the time and resources to implement these updates, it doesn’t necessarily cater to everyone’s needs. IBM understands that different businesses have different requirements and concerns, which is why they introduced Long Term Support Releases (LTSR).
The LTSR version is designed to provide guaranteed support and hotfixes throughout its lifespan, typically around two years. This means that companies have the luxury of time to fully test and stabilise the software before considering an upgrade to a new release. It’s like having a safety net that allows businesses to confidently embrace new features and improvements without the pressure of immediate change.
Now, let’s dive into why upgrading from LTSR 11.1.7 to 11.2.4 is a smart move for both technical and business users:
Reason 1 – Stability
It’s widely accepted that “Early Adopters” of new software releases often encounter software issues, or as some might say, “development opportunities.” This is especially true for a comprehensive platform like Cognos Analytics due to its sheer scale. However, as the software progresses through its release cycle, patches and hotfixes are introduced to enhance stability and improve the overall user experience. In the case of version 11.2.4, it includes all the patches and hotfixes released since 11.1.7, making it the most stable release of Cognos Analytics to date.
Reason 2 – Performance
With each new release of Cognos Analytics, there are continuous improvements in performance. When you consider the cumulative effect of these iterative enhancements since the last LTSR release (11.1.7), the difference in performance becomes quite significant, especially when it comes to handling large data sets and optimising dashboard performance.
Reason 3 – User-Friendly Interface
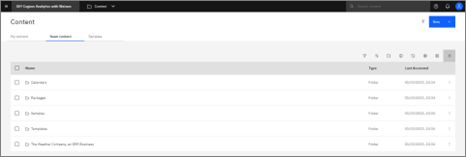
IBM has truly paid attention to user feedback, and it shows in the revamped user interface of Cognos Analytics 11.2.x. The new interface is incredibly user-friendly and visually appealing. Say goodbye to the cumbersome slide-out panels for content navigation, search, and schedules/activities (yay!). Instead, they have been replaced with full-screen views, giving you the option of tiled or list layouts. This change makes the platform much more intuitive to navigate and enhances the overall user experience.
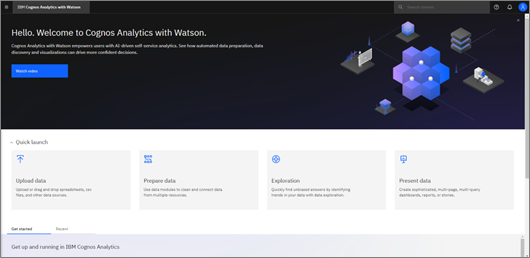
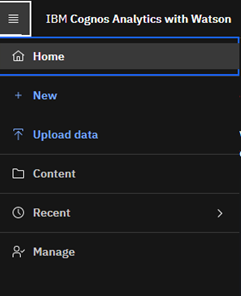
You’ll also notice a fresh new homepage that greets you with easy-to-access tiles for key functions like Uploading Data, Preparing Data, Exploration, and Presenting Data. These convenient tiles make it a breeze to navigate and quickly jump into the specific tasks you need, streamlining your workflow and saving you valuable time.
In a move to optimise screen space, the traditional sidebar has been replaced with a sleek “Hamburger” menu. Now, you can enjoy a clutter-free interface, with the sidebar discreetly tucked away. Simply click on the icon located in the top left corner, and the sidebar elegantly slides into view, providing easy access to essential features and options. This enhancement not only maximises your workspace but also adds a touch of modernity to the overall user interface.
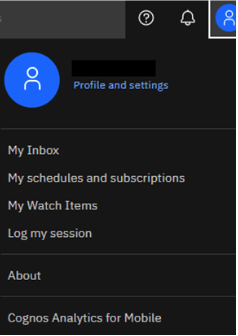
The personal menu has undergone a neat and organised makeover, bringing a sense of tidiness to the interface. Groupings have been strategically rearranged to declutter and streamline the overall experience. This thoughtful improvement ensures that everything is well-organised and easier to navigate, eliminating the potential messiness that might have been present before.
Reason 4 – Advanced Search Functionality
The search functionality has undergone a significant transformation since 11.1.7. The cumbersome slide-out panels from the previous version are a thing of the past, replaced by a seamless full-screen search experience. You now have the option to view search results in a convenient tiled or list format. Plus, there’s a permanent search bar located at the top of the screen, always accessible for quick and effortless searches. These enhancements make finding what you need a breeze, without any unnecessary distractions.

Clicking on items in the search results now seamlessly takes you directly to the corresponding location in the content view. This eliminates the need for constant switching between the search results fly-out pane and the content pane, streamlining your workflow.
Not only that, but the search functionality has also been enhanced with a more intuitive approach. The default search operator has been updated to AND, making it easier to find precisely what you’re looking for.
Moreover, additional filter options have been introduced, allowing you to narrow down your search to specific categories like report views, jobs, and shortcuts. These filters can now be saved alongside your search results, saving you time and effort in future searches.
One of the great improvements is that searches are now context-sensitive, providing results that are relevant to your current location within the portal. This means you can search within subfolders rather than searching through the entire content, making it more efficient and targeted. These enhancements truly enhance the search experience, empowering you to quickly find the information you need within Cognos Analytics.
Reason 5 – Enhanced Dashboards and Data Visualisation
Dashboards have undergone numerous significant changes, and we’ll attempt to provide a concise overview of the key updates. Consult our pdf guide 👉🏼 for a comprehensive list of all the changes: Upgrading-to-Cognos-Analytics-11.2.4 👈🏼
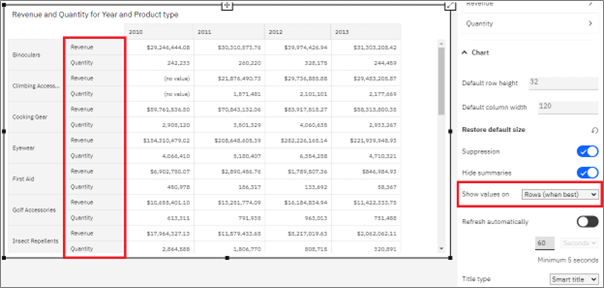
Display multiple measures on rows instead of columns
Now, you have the flexibility to display multiple measures on rows instead of columns in your crosstab visualisations. In the past, if you needed to include multiple measures in a crosstab object within a dashboard, they could only be shown in the columns. However, with the latest update, you can easily add multiple measures to the rows of your crosstab. To switch between rows and columns, simply utilise the “Show values on” property of the crosstab. This enhancement provides you with more options for organising and presenting your data effectively.
OLAP Enrichment
In earlier versions of Cognos Analytics, a feature called “enrichment” was introduced for relational items. Enrichment allows you to add additional metadata to a data item to provide more context and describe its intended usage. For instance, in the past, a data item like CITY or COUNTRY would be recognised as a regular attribute or text item. However, with the introduction of enrichment, these data items can now be automatically recognised as geographical items, enabling you to visualise them on a map within a Cognos Analytics dashboard.
Excitingly, in the latest release of Cognos Analytics (11.2.4), the enrichment capability has been extended to support OLAP sources, such as Cognos Powercubes. This means that you can now apply the same enrichment concept to OLAP data, unlocking the potential for enhanced visualisations and analysis within your Cognos Analytics environment. This expanded enrichment functionality opens up new possibilities for leveraging your OLAP data and creating more meaningful insights in your dashboards.
New Visualisations
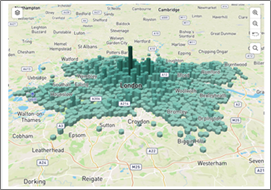
Introducing 3D Hexbin maps, a powerful feature that enables enhanced interaction and customisation of map displays with multiple layers. To illustrate this capability, let’s take a look at an example from the IBM website showcasing a 3D hexbin map. In this particular visualisation, the data points are mapped to elevation, providing a unique perspective and deeper insights. With 3D Hexbin maps, you can now go beyond traditional mapping techniques and leverage the richness of spatial data to uncover patterns and trends in a visually compelling manner.
Boxplot and Radar visualisations are now available in Dashboards.
Narrative insights and forecasts in dashboard visualisations
Narrative insights revolutionise the way dashboard creators analyse and communicate their business data. This powerful feature seamlessly integrates natural language explanations, enabling users to gain deeper insights into data, understand key drivers, and identify outliers. With narrative insights, the process of interpreting and explaining complex data becomes effortless, empowering users to uncover valuable information and tell compelling data stories in a more intuitive and human-like manner.
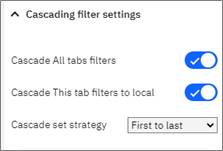
Cascading filters in dashboards
Cascading filters enhance the filtering capabilities by enabling prompts to dynamically adjust based on selections made in other filters. This powerful feature allows for a more refined and targeted analysis, where the choices made in one filter automatically influence the available options in subsequent filters. By leveraging cascading filters, users can effortlessly narrow down their data exploration and focus on the specific aspects that matter most.
Zoom levels on the dashboard canvas
Cognos Analytics dashboards now offer more control over the zoom level for content sizing. Whether in relative or absolute size mode, you can adjust the zoom level from 50% to “fit to width” or “fit to page”. Dashboard authors can also set the default zoom level for a better user experience.
Multivariate Forecasts in dashboards
Multivariate forecasts in Cognos Analytics consider multiple time-dependent variables. With the new “Optional factors to consider” section in the Forecast options, you can include additional data points in your forecast. Choose up to 5 optional factors to enhance the accuracy and insights of your forecasts.
Reason 6 – Reporting Enhancements
Bulk conversion of queries and analyses – You can now conveniently convert multiple legacy Query Studio or Analysis Studio reports to Cognos Analytics reports in bulk. As Query Studio, Analysis Studio, and Workspace will be deprecated in a future release, 11.2.4 is the last version of Cognos Analytics to include these tools. Ensure a smooth transition by taking advantage of the bulk conversion feature.
New VIDA Image service – In earlier versions, certain visualisations like maps, donut charts, treemaps, bullet charts, and Marimekko charts were restricted to HTML output and couldn’t be rendered in PDF and Excel reports. However, with the new Image Service in 11.2.4, these visualisations can now be effortlessly included in both PDF and Excel formats. Enjoy enhanced flexibility in presenting your data across different report types.
Copy values from HTML report output – In earlier versions of Cognos (Cognos 8, Cognos 10), users were able to select and copy text directly from an HTML report in the browser. However, this functionality was unfortunately missing in Cognos Analytics. But fret not! In 11.2.4, we’re happy to announce that this much-needed feature has been re-introduced. To copy a specific value, simply highlight it and click on “Copy raw value” in the Report Viewer toolbar. Enjoy seamless data extraction from your HTML reports.
Active Report Viewer – You can now view Active Reports offline, even without access to the Cognos server. In the past, the file format for Active Reports (MHT) could only be opened in Microsoft browsers like IE and Edge. Opening them in Firefox or Chrome required a browser extension. But we’ve got great news! With the free-to-download tool from IBM, you can now easily open Active Reports in any browser. Simply visit https://accelerator.ca.analytics.ibm.com to get started with Active Report viewing.
Reason 7 – Assistant and Exploration Enhancements
Improved visualisation details – significant improvements have been made to the visualisation details in Explorations, making them even more readable and insightful. The natural language insights have been refined to be more concise and user-friendly, enabling you to swiftly review crucial information from your data analysis. Get ready to delve into data with greater ease and clarity.
New visualisations in explorations – What is also exciting to announce is the addition of two powerful visualisations – Box Plot and Radar Chart – to enhance your data exploration experience. With these new options at your disposal, you can gain deeper insights and uncover valuable patterns in your data like never before. Start leveraging the power of Box Plot and Radar Chart in your explorations today.
Relative time – the AI assistant now recognises relative time expressions (e.g., YTD, MTD) and recognises US holidays (e.g., Memorial Day, Mother’s Day). This means you can effortlessly ask questions like “show me revenue for last year” or “show me revenue for last Christmas” and receive accurate and relevant insights. Experience the convenience of working with relative time and holiday references in your queries with the upgraded AI assistant.
Reason 8 – New Mobile License Options
New license for Mobile Only users – new license entitlement has been introduced, specifically designed for users who exclusively utilise the Cognos Analytics mobile app and do not access the desktop portal. With this licence, mobile-only users are granted the following entitlements:
- Consume shared pin boards
- Receive alerts
- Use the Assistant
- Create pin boards
- Browse Team Content
- Open dashboards and explorations in the app
Reason 9 – Modeling improvements
Dynamic as_of_date parameter – Introducing a new feature in Data Modules that allows users to specify a dynamic date for the as_of_date parameter. Now, you can utilise relative time expressions like “yesterday” or “last week” to set the value of the as_of_date parameter. To unlock this functionality, you will need to implement the Gregorian Calendar data module, which is readily available in the IBM Accelerator catalog.
Sorting in the data module tree – it is now possible to implement a new enhancement that allows you to sort the metadata in the data tree based on either the label or data type. This feature provides you with the flexibility to organise and navigate through your metadata more efficiently, ensuring a seamless data exploration experience.
Alias and shortcut tables in data modules – In response to user feedback, a convenient solution has been introduced to address the challenges faced when creating shortcuts or aliases to existing tables in data modules. Previously, a complete duplication of the table was necessary, leading to unnecessary complexity in data module design. With the latest update, you can take advantage of tables of type “alias” and “shortcut.” These tables function similarly to shortcuts and aliases in Framework Manager. Shortcuts serve as references to the original table, preserving selected table relationships, while alias tables reference the original table without retaining the selected table relationships. This enhancement streamlines the data module design process and provides more flexibility for modelers.
Dynamic Source Override – A dynamic source override feature for data modules has been implemented, enabling you to redirect them to different data server connections, schemas, or catalogs during runtime. This functionality mirrors the capabilities previously available in Framework Manager, providing you with enhanced flexibility and control over your data sources. It’s important to note that this feature is currently applicable only to data modules created from DATA SERVER sources and cannot be utilised for data modules created from packages or data sets.
In conclusion, upgrading to Cognos Analytics 11.2.4 LTSR is a smart move due to its stability, performance improvements, user-friendly interface, enhanced search functionality, improved dashboards and data visualisation, upgraded reporting capabilities, AI assistant and exploration enhancements, new mobile license options, modeling improvements, and dynamic source override feature. By embracing this upgrade, businesses can leverage the latest features and improvements in Cognos Analytics to enhance their data analytics and decision-making capabilities.
For a comprehensive list of changes consult our pdf guide
👉🏼 Upgrading-to-Cognos-Analytics-11.2.4 👈🏼
About the author
John Wilkinson is a highly skilled Senior Business Analytics Consultant/Solutions Architect with over 19 years of experience in IBM Cognos BI. He is widely recognised as a top consultant in the industry, known for his exceptional technical skills and positive attitude. John has extensive experience in IBM Cognos Analytics, including proficiency in IBM Planning Analytics, and i2 marketplace. With 8 IBM professional certifications and a strong understanding of IT principles, both hardware, and software, John brings a valuable perspective to his work. What sets John apart is his commitment to providing exceptional customer experiences. He is known for his outstanding interpersonal skills, and his ability to build strong relationships with clients and colleagues alike. He is not only a technically proficient consultant but also a great communicator who is adept at working with people to solve complex problems. With a wealth of expertise in IBM Cognos BI, Cognos Analytics, SQL, Planning Analytics, and surrounding technologies, John is a highly valuable consultant in the field of business analytics. His extensive experience and exceptional skill set enable him to deliver top-notch solutions and consultative advice to clients, making him a sought-after expert in the industry.