


Anaplan Master Anaplanner Blog: RANK and row counts – Management Reporting with multiple lists
A common request within any planning project is to create well-formatted, standard reports for the business to consume. However, these aren’t always as simple to create as first thought.
The Management Reporting capabilities within Anaplan produce great looking outputs. However, they require a fixed number of rows for each page and when creating reporting packs, the number of rows to display per page often changes depending upon the business hierarchy.
This article describes a solution for the property and construction industry, but the same principle can be applied to any report. By firstly counting the number of rows and then calculating the number of pages needed, an output can be produced that caters for any number of rows, delivering a very clean and professional report that maximizes the benefits of Anaplan’s connected planning platform.
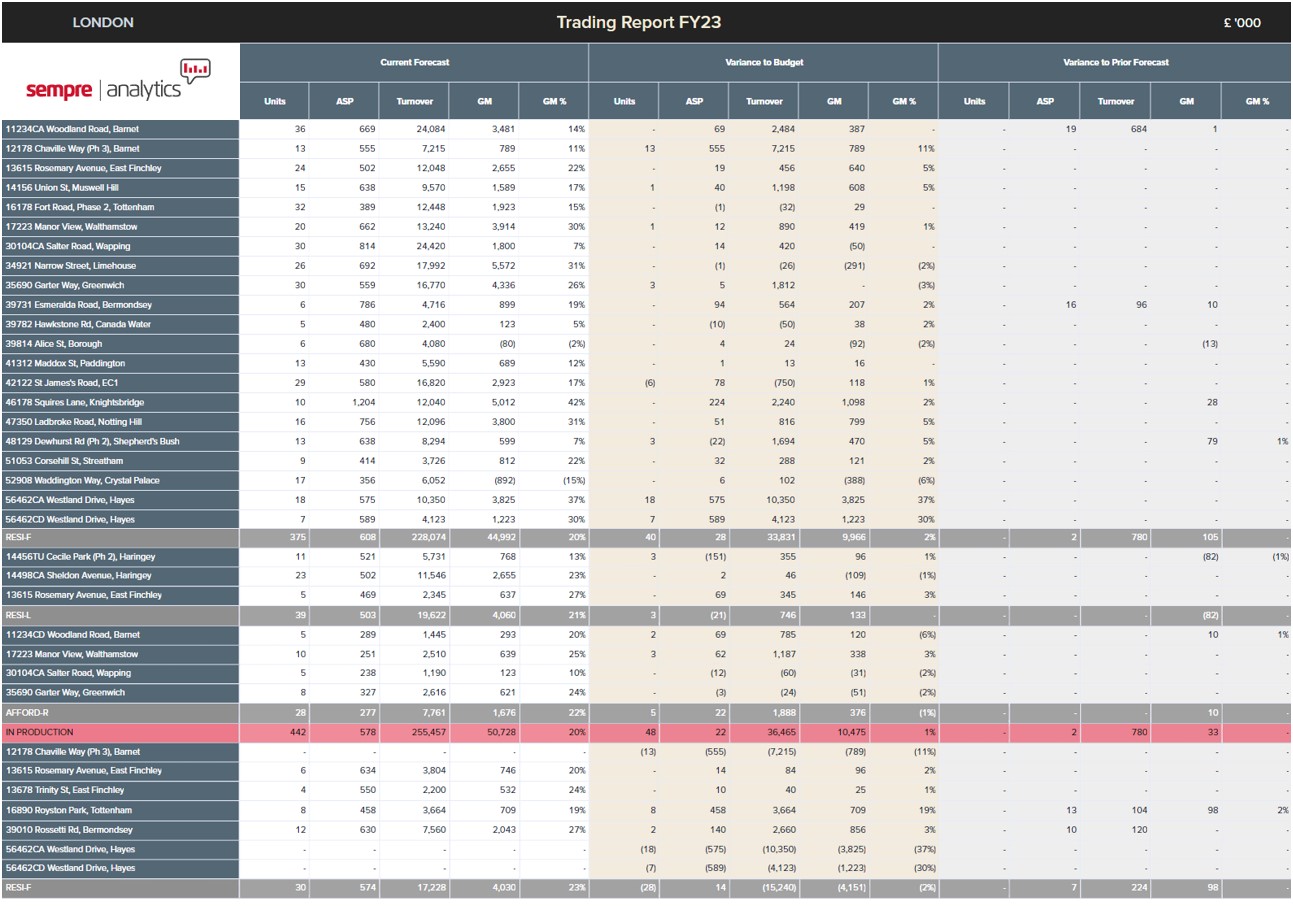
Report Page 1
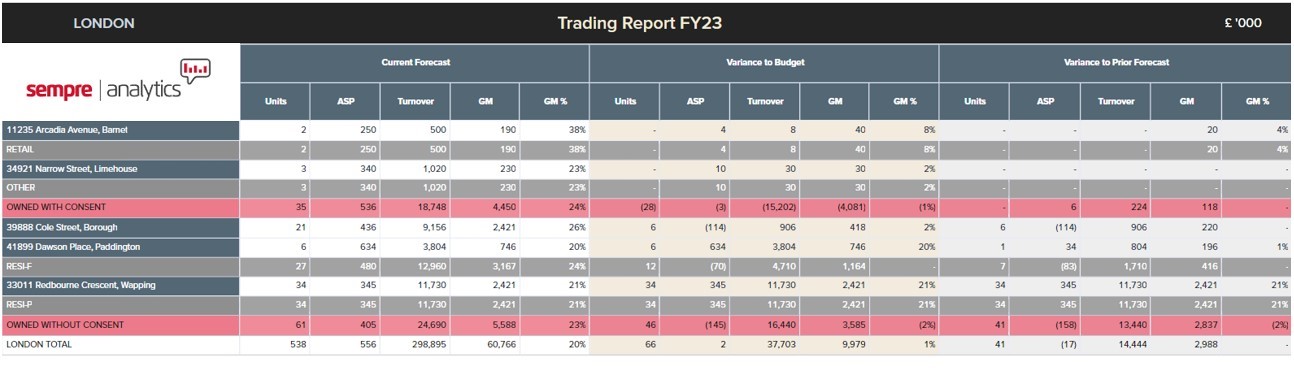
Report Page 2
Task
- A property company has the following hierarchy: L1 Region > L2 Local Area > L3 Equalization > L4 Contract > L5 Unit
- The company’s Regional Directors want a report of contracts within their region that have a legal completion date in a particular period (for example, FY23), and would like to see various metrics for the Current Forecast (which is refreshed monthly), as well as variances to Budget and Prior Forecast
- As well as by Contract (Level 4 of the main hierarchy), the report must be dimensioned by:
- Contract Status – a contract can change status as the property goes through different stages of production; for example, the property can be Owned without consent in one month and Owned with consent the following month
- Sales Type – a contract can contain units of different sales types, for example a mixture of residential and retail units
- The report needs to be filtered to remove contracts where there are no values in that time period
- The report needs to display sales type and contract status totals
Problem to solve
This report is difficult to produce using the Management Reporting in Anaplan because currently Anaplan will not automatically print a module across several pages where there are more rows to print than can be displayed on a single page. The report also needs to be dynamic. If each Region had the same number of contracts, then the solution would be a lot simpler. However, each Region will have a different number of contracts with different legal completion dates and, therefore, one Region’s report will run to a different length (number of rows) than another’s. This needs to be accommodated in the solution.
The desired solution will count the numbers of rows that need to be printed for each Region so that we can mimic this printing across several pages by creating several pages of a report and applying different filters to each page: page 1 will print rows 1 to 40, page 2 will print rows 41 to 80, page 3 will print rows 81 to 120, and so on.
Using the RANK function
To produce this report, start with a few simple steps:
- Set up a filter in the module to show only contracts and contract status/sales type totals with non-zero units
- Then create a Contract Status/Sales Type combination (a number) that we will rank to create the row count
- Include the Region Code as a line item as this is needed in the Rank formula to ensure that values are ranked independently for each Region (making the solution dynamic)
- Explore using the Rank function to establish the number of rows in the report; the image below shows two columns of results of the Rank function with different summaries:
A. Rank function with Formula summary
B. Rank function with Max summary
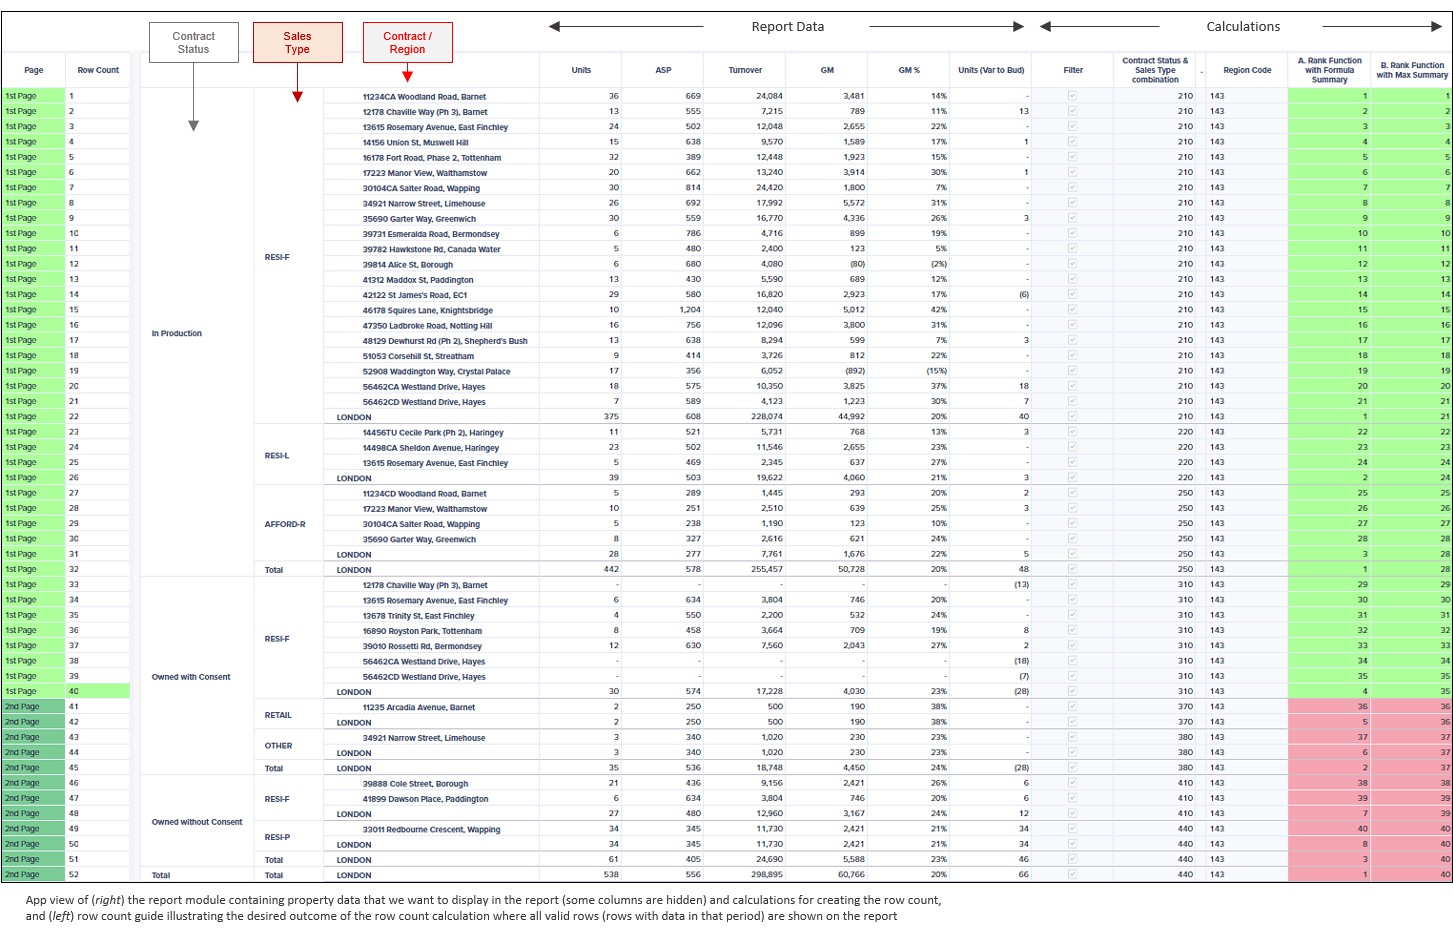
In both cases, if we were to filter the module on columns A or B to show values 1 to 40 for the first page, all the items in red would not appear on the report. For example, the item Owned without Consent / RESI-F / 39888 Cole Street, Borough has a value of 38 in columns A and B, so would be included in the filter, but it is actually row 46 (when the subtotals are included!), as you can see from the row count guide on the left, and would therefore ‘fall off’ the page because the report can only show 40 rows comfortably on an A3 report.
The items in red also would not appear on the second page of the report because the module is filtered to show only values 41 to 80 on the second page.
So we have a problem using the Rank function alone, when (i) we want to rank the summaries/totals and (ii) the module is pivoted with more than one list along the rows and includes a list that is part of a composite hierarchy (Contract being Level 4 in the hierarchy).
Column B is a good start – it comes close to doing what we want – but we still lose rows! The only way to guarantee that all rows are printed correctly is if each row has a unique row number.
Solution
The problem with column B is that it does not consider the totals that we want to display in the report, for example, the RESI-F total or the In Production total.
But if we can produce a sequence of the totals that we want to display, then we can shift the values in column B by the correct amount to arrive at a Final Filter Value that will hold unique numbers for every row in the report. Here you can see the sequences:
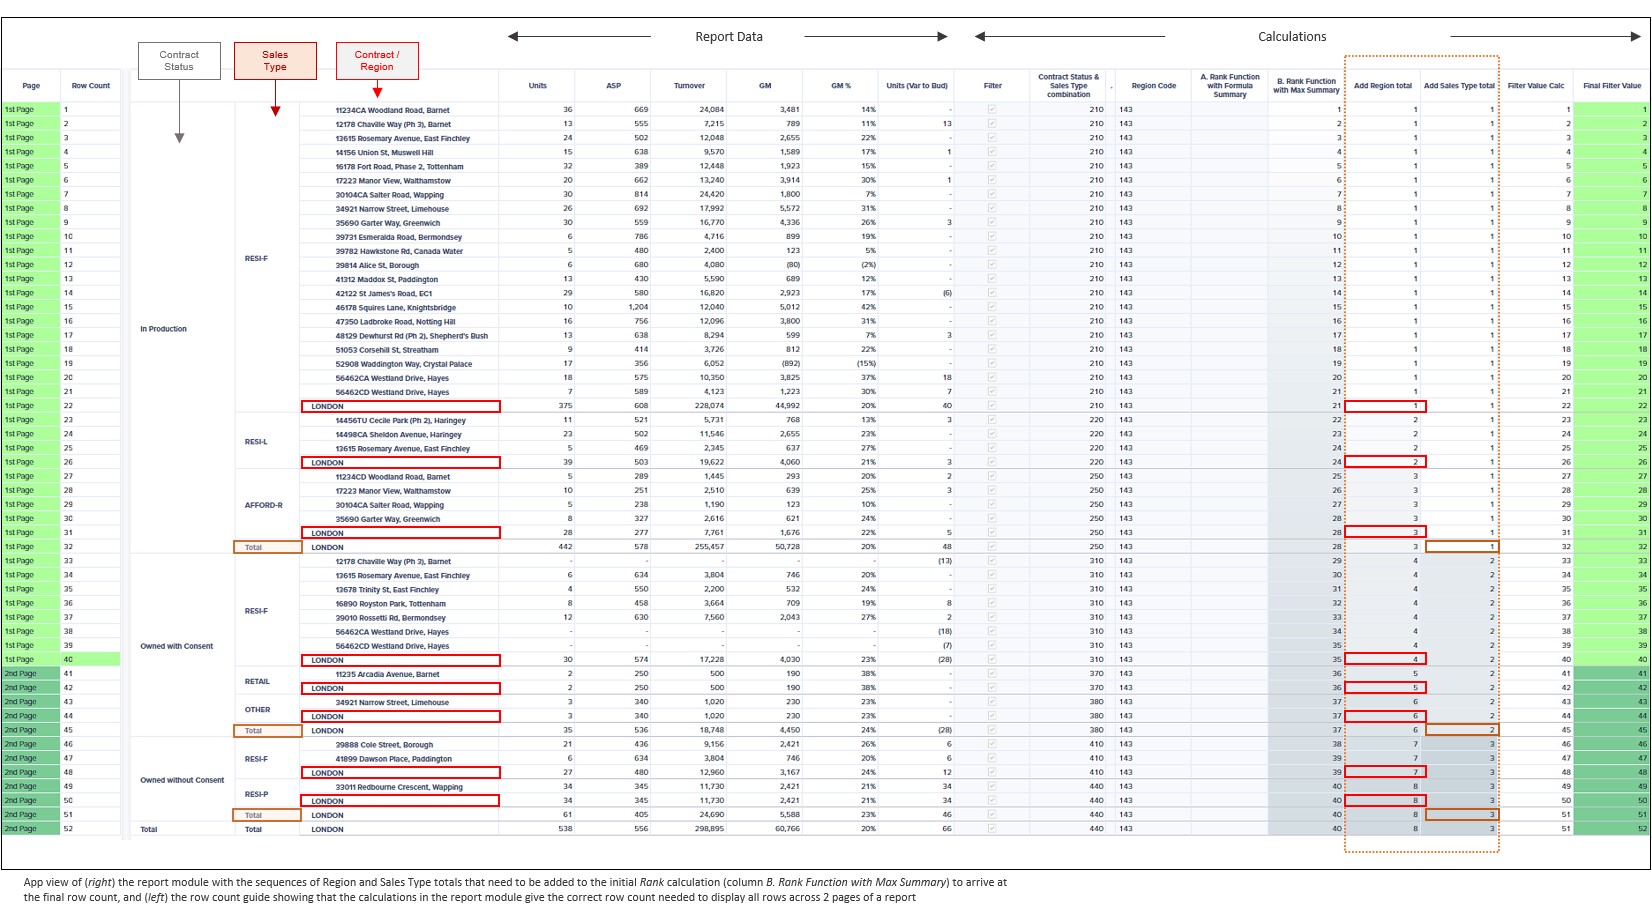
Then:

Finally, for the total of all Contracts/Contract Statuses/Sales Types (the final row), just add 1:

Once each of the rows has a unique number it’s very easy to set up the slides in the Report using filters, just as you would on a Board or Worksheet. Create the page of the Trading Report (slide 4) by setting the Final Filter Value line item to Greater than 0 and Less than or equal to 40.
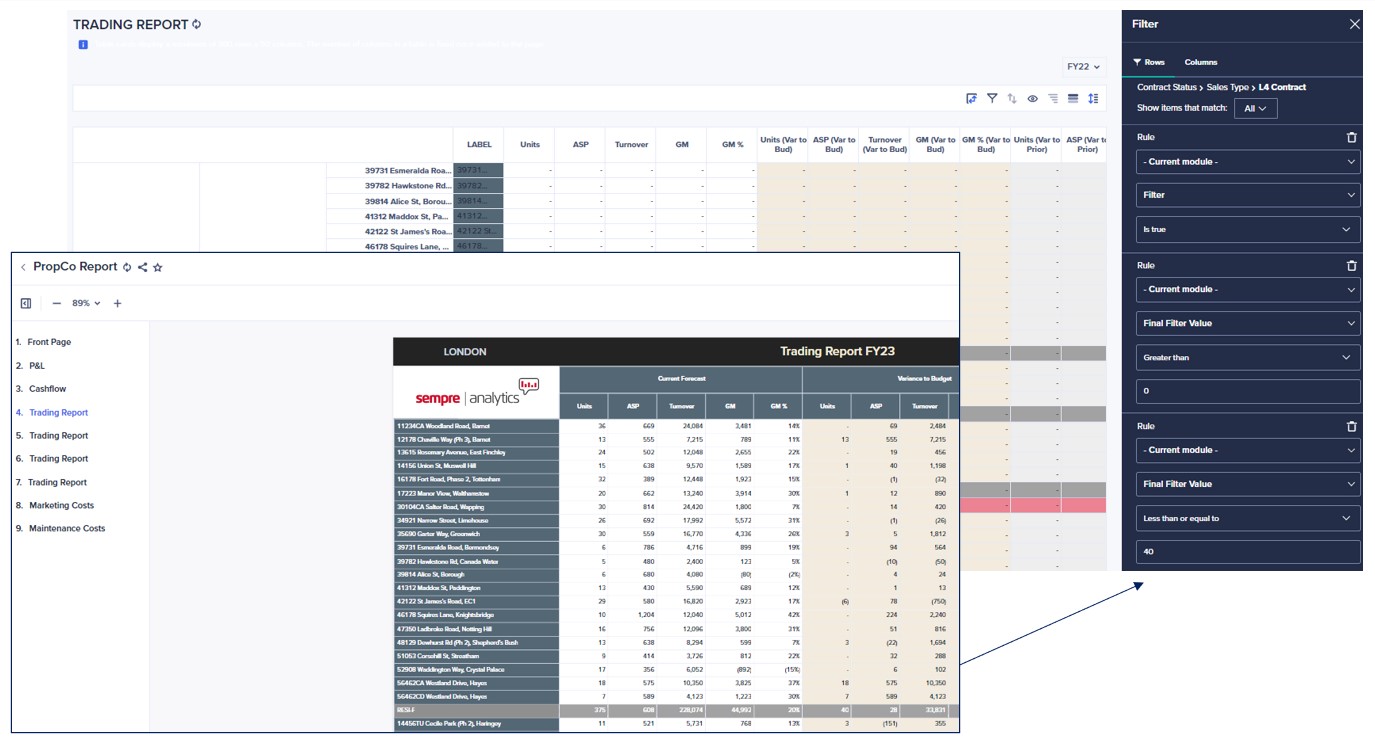
Filter Settings
Then duplicate this slide three times, so each looks identical with the same layout and formatting, but change the filters as follows:
- Slide 5 has a Row filter set to the Final Filter Value line item of Greater than 40 and Less than or equal to 80
- Slide 6 has a Row filter set to the Final Filter Value line item of Greater than 80 and Less than or equal to 120
- Slide 7 has a Row filter set to the Final Filter Value line item of Greater than 120 and Less than or equal to 160
If you know roughly how many rows there are going to be in the report for each period, you can create an appropriate number of slides (including a couple of extra slides in case there are more rows than expected).
Of course, where there are fewer rows in the report, these will simply show the module headings and no data. This is not ideal, but you can create another module that shows which page numbers to Export to PDF and then print only Selected slides.
Export to PDF
The Final Filter Value line item can be referenced in another module that will determine which pages to export for each Region:
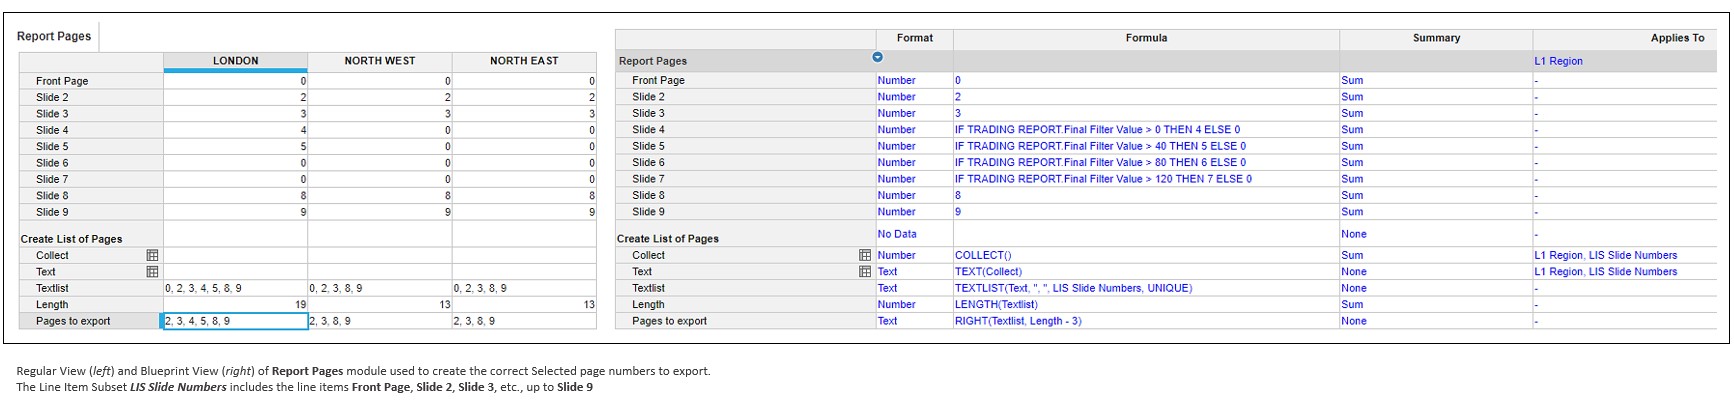
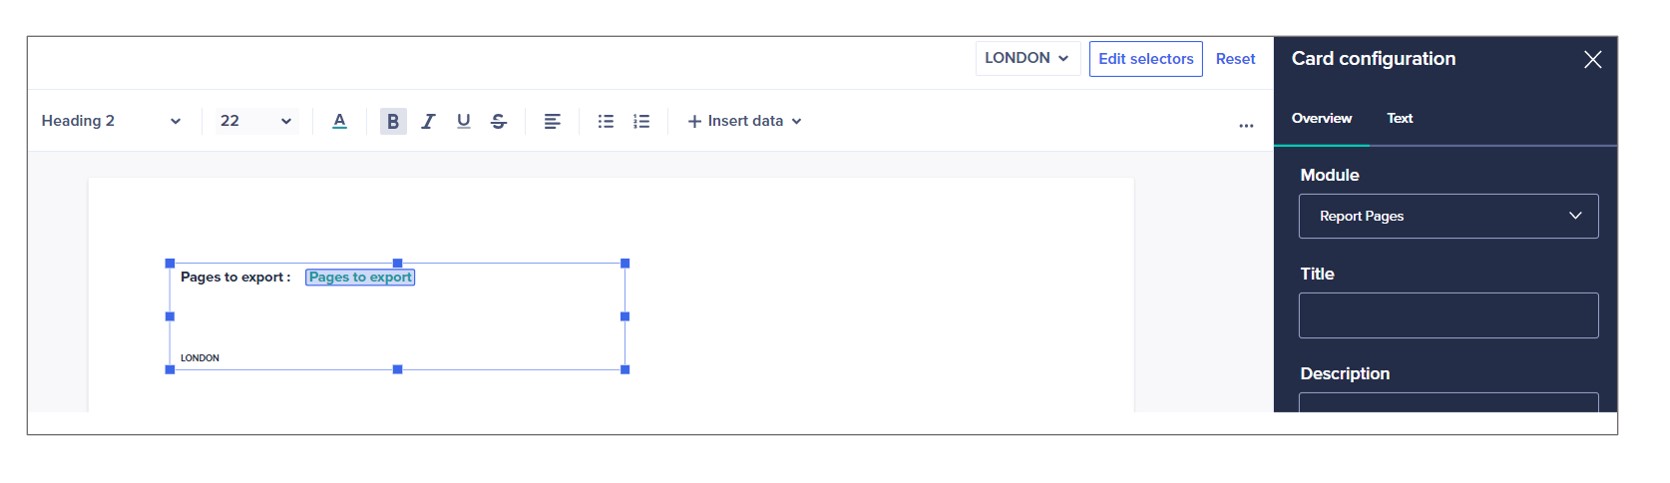
Once the Report Pages module has been created, add a Text card to the first slide of the report and display the line item Pages to export from the module.
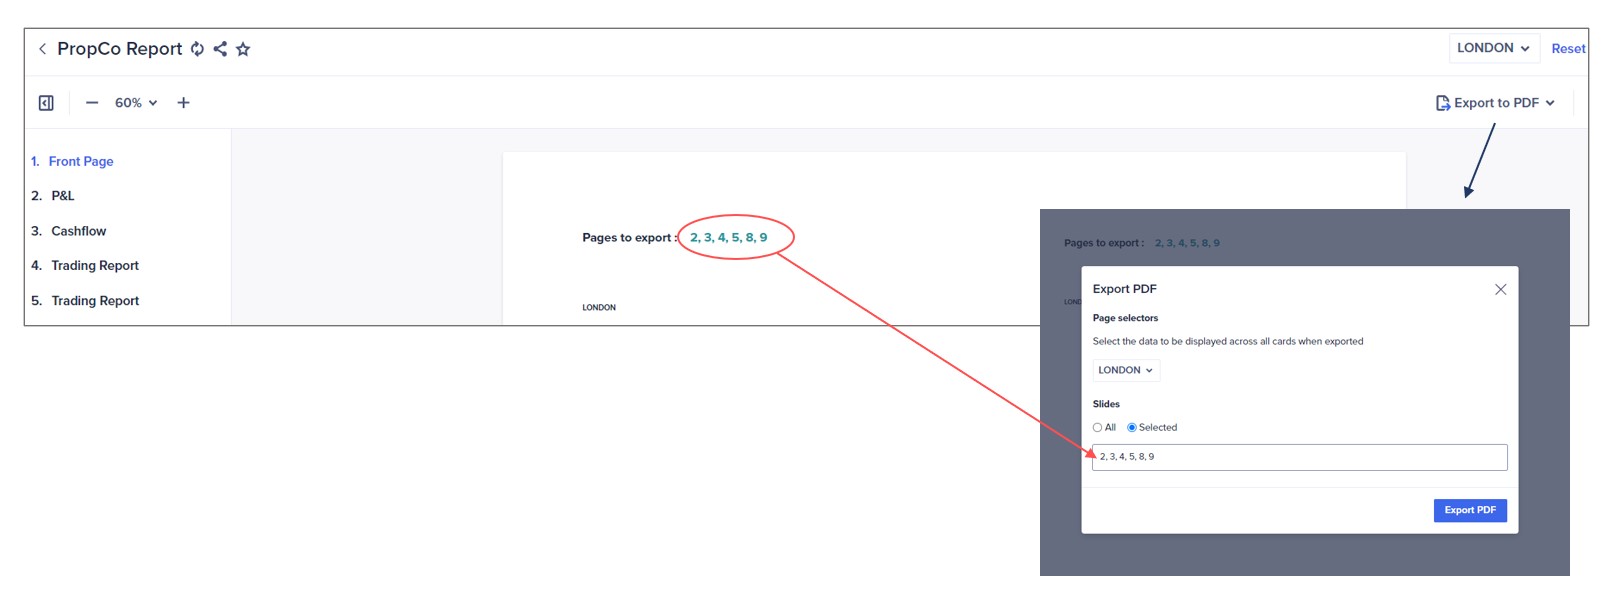
Finally, copy the page numbers displayed, then click on the action Export to PDF on the top right of the Report and paste these page numbers into the Selected option on the Export PDF screen. This will produce a report with all the correct data of the Trading Report and no blank pages.
Max is a Master Anaplanner and Solution Architect at Sempre Analytics. He has led FP&A, Consolidation, and Supply Chain implementations for a variety of customers across Property & Construction, Insurance, Banking, Pharmaceuticals, Agrochemicals, Education, Technology, and Retail. Max has a Master’s in Finance & Investments from Rotterdam School of Management and a Master’s in Global Governance & Public Policy from the University of London.
To find out more about how we can help you navigate Management Reporting with multiple lists, get in touch by filling in our contact form.