
Since Version 11.1.0 was released in September 2018, IBM has enhanced the capabilities of Cognos Analytics at great speed over seven releases. In that time, huge strides have been made on the customisation, user interaction, data modelling, dashboarding capabilities and comprehensive visualisations within the toolset. Now that the 11.1 family has reached its long-term support status we look forward to the next chapter.
I have been lucky enough to sit on calls and presentations over the past couple of months with IBM and had a sneak preview of the features coming down the pipeline for Version 11.2…and I am pleased the say that the vast majority of what was promised has been delivered in Version 11.2. When it comes to making smarter decisions, and faster ones, those new features will come in very handy.
Let’s look that those key changes in a little more detail.
User Experience
The revamp of the user experience must be the most obvious change. The makeover of the interface to include all the major elements of the long-promised Carbon X theme are mostly complete. For those people who have used IBM Planning Analytics over the past six months you will recognise the common look and feel running through the product.
The new interface contains three main sections on the homepage, they are Welcome, Quick Launch and Getting Started / Recents.
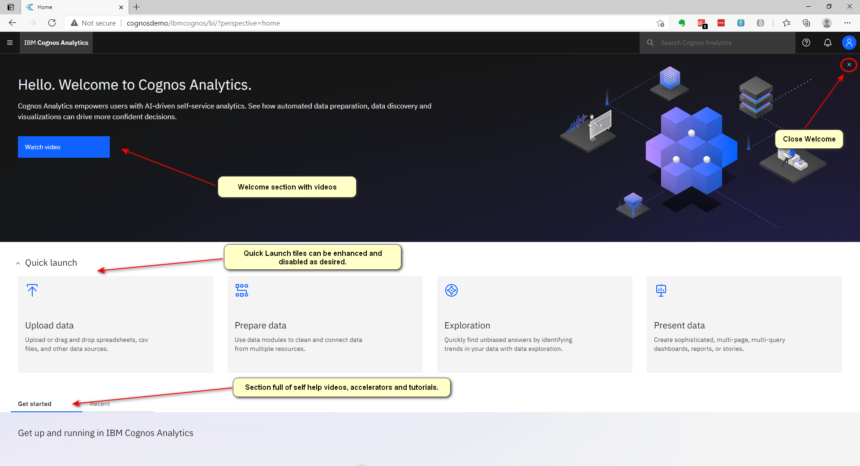
The top section of the Welcome Page isn’t useful after the first time you see it so most users will click the ‘x’ and remove it for future logons. This give you back some screen real estate. Also, the Quick Launch toolbar can be customised using extensions to increase the number of options if you wish, or you can disable some of the standard ones by role. I can see some clients wanting customisation in this area.
About customisations, I took a couple of themes I created in V11.1 and implemented them in V11.2 without any code change. It’s fair to say that most of it transferred and rendered with no issues with just a few minor tweaks required.
One thing I really like is the search bar at the top of all screens, especially this screen. Getting to focused content now becomes a lot easier.
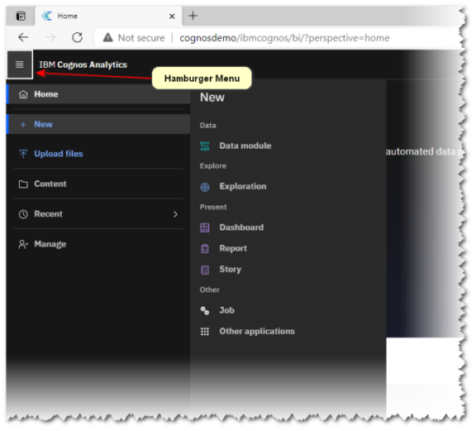
One of the areas that is much improved is the Hamburger Menu concept whereby the icon in the top left corner gives you access to the ‘New’ submenu, ‘Content’, ‘Recent’, and if you are an Administrator the ‘Manage’ menu. This looks so much cleaner than the previous version and a big improvement in my eyes.
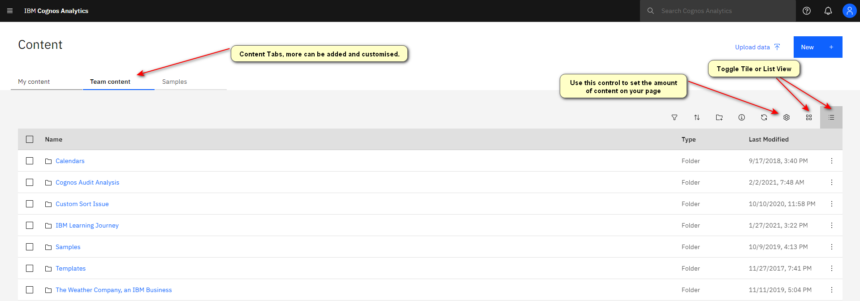
If you click the content option from the Hamburger Menu you get a great new tab-separated view of My Content, Team Content and Samples. Other tabs can be added in the same way Portal Tabs in Version 10 used to work and it’s a great clean redesign of the interface. I really like the settings where you can compress the content to get more onto the screen and the toggle between tiles and list view. As an old traditionalist, I like list view and most Version 10 upgraders will find this useful, but if I were using a touch screen I can see why ‘tile view’ would work well.
AI, Forecasting and Watson Integration
One of the growth areas where IBM are putting a lot of their development effort is around AI and Watson Integration. The AI assistant has been around for a couple of years now and has been improved release by release. Normally, when I write these kinds of articles it gets a mention towards the end, but I think this release justifies higher billing.
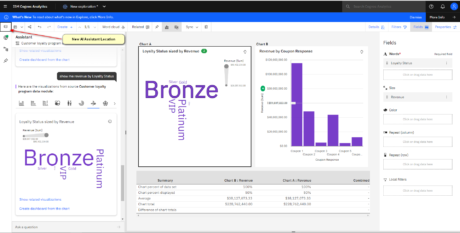
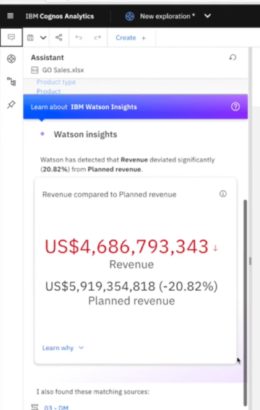
Previously, the AI assistant has only worked on relational data sources. However, Multi-Dimensional sources are now supported, meaning that insights can be obtained using the Explore functionality on all those sources that you have spent a lot of time building and refining such as Planning Analytics (TM1) cubes, Dynamic Cubes, Transformer Cubes etc. I have looked at some of these over sample cube data and, whilst a lot of the findings are obvious, the AI assistant does look deeper and uncovers some useful insights. The AI assistant has also been enhanced with extra capabilities called ‘Watson Insights’ where insights are presented onto the screen. I saw this demonstrated by IBM offering management, but I have not managed to get this working for myself yet. I get insights but not the same ‘Lightbulb’ moment. However, just having explorations supporting OLAP as well is worthwhile. I believe that the ‘Watson Insights’ functionality is baseline for this release and will be comprehensively built on over the next few releases.
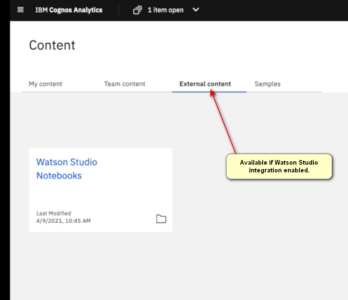
The integration with Watson Studio has also been strengthened.
Direct access is now provided when integration has been enabled as shown. You navigate to the notebook you want to import into Cognos and follow the wizard to save it into the relevant area of Team Content.
 Once you import the Notebook, you can start working with it immediately. Once open, you see all the elements that were in Watson Studio.
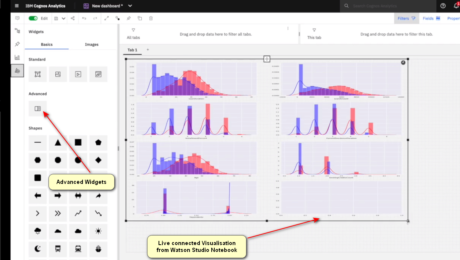
Also, within Dashboarding you can use the Advanced Widgets to select your notebook and pick a particular part of it for inclusion into your Dashboard.
Dashboarding
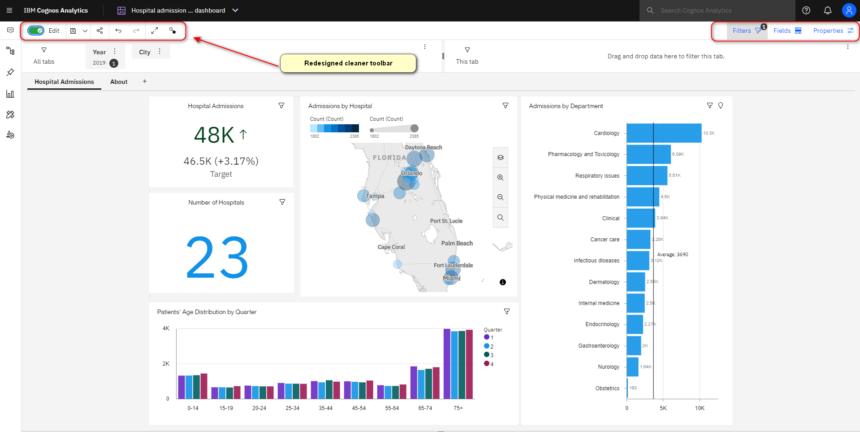
In Version 11.1 Dashboarding came a long way. In this release a few improvements to the user interface have been made. I particularly like the toggle between edit mode and view mode. We also have two new visualisations in BoxPlot and Radar, but the biggest thing for me is the improvement in performance. I have tested some of my production dashboards written in Version 11.1 and they are on average over 40% faster than before with no loss of function or feature. That is exceptional in one release and perhaps, if you are Dashboard heavy in your installation, the one single reason to upgrade.
Mobile
Since the release of the new IBM Cognos Apps we have seen more support for them. Android is now supported, on premise is now supported from Version 11.1.7 FP2+, but it’s all in the box now for Version 11.2. There are no new features as yet, but more will be added throughout the life of 11.2.
Reporting
As well as BoxPlot and Radar Visualisations, the biggest enhancement in reporting is the ability to extend baselines by using Query or Layout Calculations. This will be really useful for those reports where fixed baselining was not possible.
Compliance
One of the key compliance changes with this release is the removal of support for Internet Explorer 11. Microsoft has stopped support for this browser and IBM has followed suit. This is not a problem for those clients who are using the new capabilities like Dashboarding and Reporting. However, clients who use legacy studios like Analysis Studio can now only access them through the Firefox browser. This is not ideal but it’s a kick that we all need to stop using these legacy tools and embrace the new, fit for purpose interfaces.
Recommendations
In short, this release contains some great improvements in several key areas. My recommendations would be as follows.
Upgrade to 11.2 if you fall into one or more of the following categories:
- You use Dashboarding extensively and would benefit from the performance improvements.
- You are currently on Cognos BI Version 10 and not reliant on legacy Studios.
- You have a requirement to use Watson Studio or you have a lot of forecasting requirements.
- If you have other browser options to replace Internet Explorer 11.
- You want to make use of the new Mobile Applications.
It is recommended to stay on Version 11.1.7 if you fall into one or more of the following categories:
- You rely on Internet Explorer 11 or Legacy Studio content.
- You have a company policy of not implementing the latest release.
- You have a lot of customisations and extensions that need to be tested. You will need to evaluate these as part of your upgrade project.
If you want to chat to us about how our Managed Service can help you with upgrades, and a wide variety of other needs to keep you make smart, fast decisions with Cognos Analytics, please download our Sempre Analytics Managed Service brochure.

Listed in:
- Uncategorized