
You know you want to have the best Business Intelligence tools to meet the ever-growing needs of your business and help overcome challenges, unearth opportunities and thrive.
- But change brings the possibility of disruption, so you are right to ask yourself
- Why should I upgrade a perfectly stable system and run the risk of issues?
- Why would I contemplate this at a time where the world is in such a state of flux?
This article will address these concerns on upgrading and give you compelling reasons why this release is the one to choose.
Reason 1 – Stability
Cognos 11.1.7 is classified as the long-term support release. This means that for the next two years IBM will support this release with defect fixes and security patches. Any defect discovered will be fixed and fix packs will be made available through IBM Fix Central. It is important to remember that any installation below Version 11.1.7 will need to upgrade to 11.1.7 if they discover a live defect.
This offers the stability that we are looking for knowing that major functionality changes will not be forthcoming, but issues will be corrected and released regularly.
Upgrading is relatively straightforward if you are already on a level of Cognos Analytics and Sempre can help you to plan and execute the upgrade.
Reason 2 – Dashboards Improvements
Dashboarding and Visualisation is fast becoming part of everyday reporting and analysis for all customers. Gone are the days where you would pour over pages and pages of numbers: information is now presented in various ways.
IBM has invested heavily on both functionality and user experience with Dashboarding. Significantly improved visualisations, incorporation of custom visualisations and improvements in the user design experience have brought them to life.
In 11.1.7 several significant new features have been made available
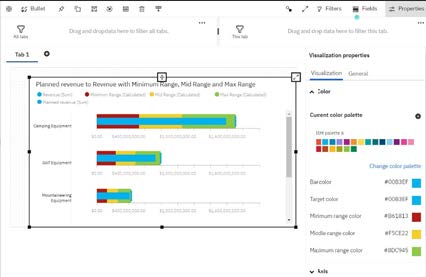
Create custom templates
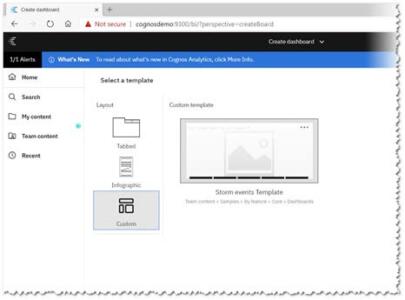 You can save an existing dashboard as a template to use to quickly create new dashboards. With a template all the chart types, colours, placement and design are retained without the data. A great way of creating starter Dashboards.
Drop Zone on Visualisations
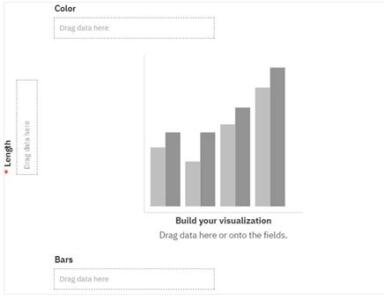 When you start with a blank visualization, drop zones guide you to here to drag your data directly on to the visualization. A great ease of use addition to speed up development.
Value Axis Logarithmic Scaling
Logarithmic scales are useful when the data you are displaying is much less or much more than the rest of the data or when the percentage differences between values are important. In the example below, you can see the effect on Revenue by Product Line. Logarithmic scaling is useful here to bring lower selling Product Lines such as Outdoor Protection to the fore.
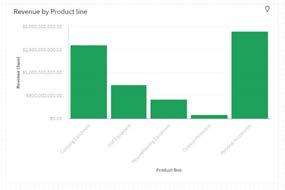
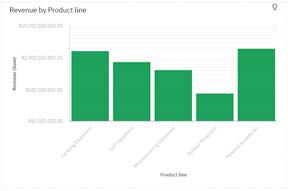
Without Logarithmic Scaling xxxxxxxxxxxxxxxxWith Logarithmic Scaling
Exporting Visualisation data to CSV
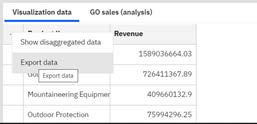 The data that makes up the visualisation can now be exported to CSV directly from the Visualisation.
Bullet Visualization range colouring
 The ability has been added to colour the ranges to aid visibility in bullet charts.
A fantastic demonstration of the capabilities of Dashboarding in
11.1.7 by IBM Offering Manager Matt Denham can be viewed here.
Reason 3 – Further Reporting Enhancements
Reporting has always been IBM Cognos’ strength for years. IBM Cognos has always covered the traditional reporting base of List and Crosstab wonderfully well over the years. Since the inception of Cognos analytics, the focus to extend the capability to world class charting, visualisation and exploration has meant that significant value has been added to the capabilities.
Over the past two releases we have seen additional visualisations, the ability to make your own visualisations and the incorporation of Schematics based on SVG files. Now with 11.1.7 we have a few more key features.
Below are some of these.
Customisable Baselines
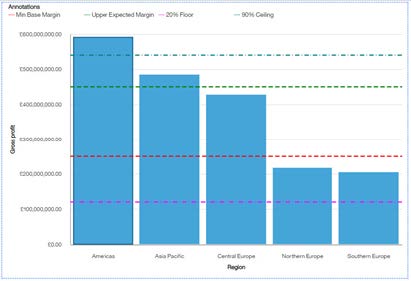 The ability to add ‘% of’ and ‘value based’ baselines into
various charts. The example below shows both types of baselines along with the colour and line type settings.
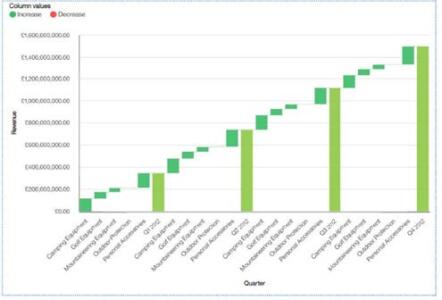
Sub-categories added to waterfall visualizations
You can use sub-categories in waterfall visualizations. Use sub-categories to display how categories are built up.
In this example, we have revenue by Quarter and a subcategory showing the impact of each product line in the quarter. The first view is the ‘actual’ cumulative revenue by quarter illustrating the contribution. The second view is using the ‘change’ subcategory setting which illustrates gains and losses. This view being particularly effective as showing where a drop in sales has occurred by Product Line.
 Using subcategory values as ‘Actual’
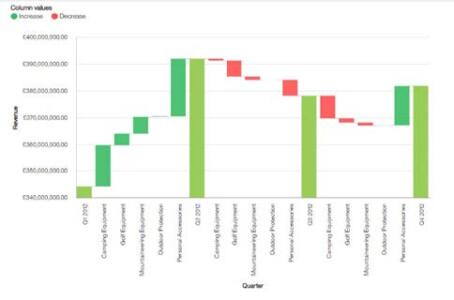 Using subcategory values as ‘Change’
Look and feel improvements
A number of the enhancements we covered in the Dashboard reason above are also included for reporting. Logarithmic scaling, Pie Chart labelling, Axis options like text direction plus others are all included.
Reason 4 – Performance
During the creation of this release, IBM development have reviewed the entire code set that makes up Cognos Analytics with a view to simplification and performance gains. During this review they have remove redundant coding, improved processing capabilities and generally seen a significant performance improvement.
One of those areas which has benefited from the performance improvement is the production of ‘large’ data sets. Previously, a large dataset could use significant RAM and CPU whilst it was being built. If this was ‘out of hours’ it wasn’t such a problem but if you want to build datasets more often this release gives you the ability to do that
without effecting your users experience as it uses significantly less resources.
Also, performance improvements around the querying and rendering of reports and dashboards have been improved.
Reason 5 – Data Modelling
Data Modules have come on a long way even since releases in late 2019. Not only are special time categories supported out of the box now the functionality has been extended in Version 11.1.7 with the addition of a Retail Calendar (4-5-4 week pattern) and associated Week to Date, Prior Week to Date, This Week last Year special time categories.
There are now Fiscal, Gregorian and Retail Calendars with the ability to create your own Calendar. There is in excess of 20 special time categories and again you can create your own for use in your Data Modules. This is a really powerful feature for anybody wish to perform date-based analysis.
Additionally, whilst not a direct business benefit, Data Modules development has become faster as IBM took feedback from the community and delivered productivity improvements to the User Interface and simplified some of the more difficult processes. What used to be twenty mouse clicks can often be five or six now.
SO WHY UPGRADE NOW?
Times are tough out there and your business needs all the tools and ammunition it can get to differentiate itself from your competitors. In order to do that you need to be on the latest release of whatever Business Intelligence software you use.
In the case of Cognos Analytics, using the improvements over the past 12 months in the tools, together with the exploration capabilities and AI to help you understand your data, will help you to make decisions based on valued information guided by the Industries leading AI provider.
And which business doesn’t want that type of certainty nowadays?
WHAT DOES THE UPGRADE PROCESS LOOK LIKE?
An upgrade project is scaled depending on the size of your environment and the version of Cognos software currently in use.
Assuming you are already a Cognos Analytics user, potentially this can be an over the top installation taking away a lot of legacy installation complexities. If you are running Version 10 or lower, then it’s a separate installation and some parallel running.
Our upgrade projects usually comprise the following steps:
- Scope of upgrade document
- Installation / Upgrade of non-Production environment. Creation of testing strategy
- Migrate content from old version to non-Production environment. Test reporting artefacts as per testing strategy.
- Install / Upgrade Production environment. Check migrated content and monitor system
- Document environment and complete project documentation.
This is a process that we have been through many times, gaining valuable experience to get you upgraded quickly and efficiently. We would be delighted to speak to you about how to help get you to where you want to be – contact us here or drop me an email via the link below.
Upgrades and installs are included in Sempre’s Managed Service which covers a lot more besides software support. Click here to read how we can take away the headache of managing your data and analytics solution so you and your business can be confident in your decision-making.

Listed in:
- Cognos Analytics,
- IBM
